Pitch (pitchProc.m)
Following [Slaney1990], [Meddis2001], [Meddis1997], the sub-band periodicity
analysis obtained by the ACF can be integrated across frequency by giving
equal weight to each frequency channel. The resulting SACF reflects the
strength of periodicity as a function of the lag period for a given time frame,
as illustrated in Fig. 26. Based on the SACF representation, the
most salient peak within the plausible pitch frequency range p_pitchRangeHz
is detected for each frame in order to obtain an estimation of the fundamental
frequency. In addition to the peak position, the corresponding amplitude of the
SACF is used to reflect the confidence of the underlying pitch estimation.
More specifically, if the SACF magnitude drops below a pre-defined percentage
p_confThresPerc of its global maximum, the corresponding pitch estimate is
considered unreliable and set to zero. The estimated pitch contour is smoothed
across time frames by a median filter of order p_orderMedFilt, which aims at
reducing the amount of octave errors. A list of all parameters is presented in
Table 29. In the context of pitch estimation, it will be useful to
experiment with the settings related to the non-linear pre-processing of the
ACF, as described in Auto-correlation (autocorrelationProc.m).
Table 29 List of parameters related to 'pitch'.
| Parameter |
Default |
Description |
|---|
p_pitchRangeHz |
[80 400] |
Plausible pitch frequency range in Hz |
p_confThresPerc |
0.7 |
Confidence threshold related to the SACF
magnitude |
p_orderMedFilt |
3 |
Order of the median filter |
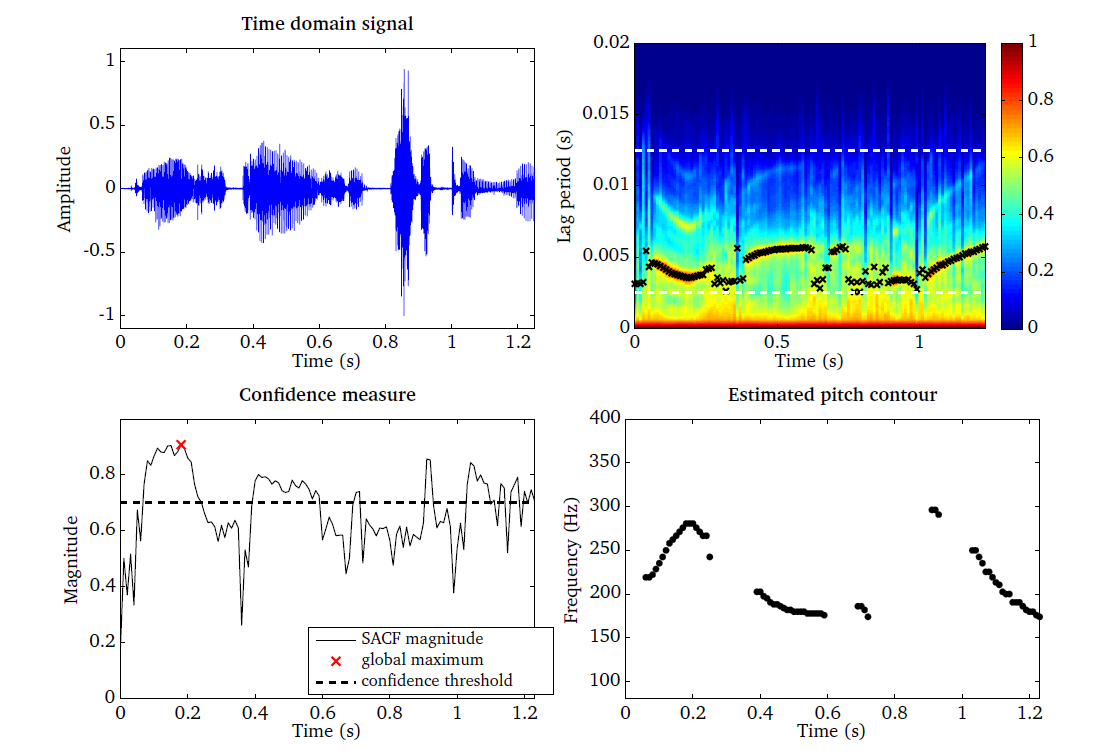
The task of pitch estimation is demonstrated by the script DEMO_Pitch and
the corresponding SACF plots are presented in Fig. 32. The pitch
is estimated for an anechoic speech signal (top left panel). The corresponding
is presented in the top right panel, where each black cross represents the most
salient lag period per time frame. The plausible pitch range is indicated by the
two white dashed lines. The confidence measure of each individual pitch
estimates is shown in the bottom left panel, which is used to set the estimated
pitch to zero if the magnitude of the SACF is below the threshold. The final
pitch contour is post-processed with a median filter and shown in the bottom
right panel. Unvoiced frames, where no pitch frequency was detected, are
indicated by NaN’s.
| [Meddis1997] | Meddis, R. and O’Mard, L. (1997), “A unitary model of pitch perception,”
Journal of the Acoustical Society of America 102(3), pp. 1811–1820. |
| [Meddis2001] | Meddis, R., O’Mard, L. P., and Lopez-Poveda, E. A. (2001), “A computational
algorithm for computing nonlinear auditory frequency selectivity,” Journal
of the Acoustical Society of America 109(6), pp. 2852–2861. |
| [Slaney1990] | Slaney, M. and Lyon, R. F. (1990), “A perceptual pitch detector,” in
Proceedings of the IEEE International Conference on Acoustics, Speech and
Signal Processing (ICASSP), pp. 357–360. |