Experiment results
In this part of the database we collect results from psychoacoustic experiments run by the different labs involved in Two!Ears. In addition to the results we provide the underlying stimuli in a way that they can directly be fed into the Binaural simulator and provide the model with exactly the same audio input as the listeners experienced during the actual experiments.
Human label file format
The test results are called human labels in the following and the average results of the single experiments are all stored in the same way in the human label file format. This is a simple csv file, which includes the following entries:
# Description of the results stored in the file
# stimuli, rating, 95% confidence interval
experiments/link_to/brs_file1.wav, -0.4653, 0.0123
experiments/link_to/brs_file2.wav,  0.2738, 0.1548
...
The file starts with a header that uses # as a comment sign and then
includes at least three columns. The first one provides a link to the actual
BRS file used in the experiment. The second one the average result from the
experiment, this could be a mean, a median, or something else, and the third one
showing the variance of the data, in most of the cases in the form of the
confidence interval. The files could of course have more columns with additional
information, like the time the listeners needed to response or if another value
like the sound pressure level was changed during the experiment it could be
indicated in a later column.
Besides the human label files, most experiments provide the anonymised results from single listeners. The format of those data can vary, but in all cases they are provided as plain text or csv files.
Coloration
2013-05-01: Coloration of a point source in Wave Field Synthesis
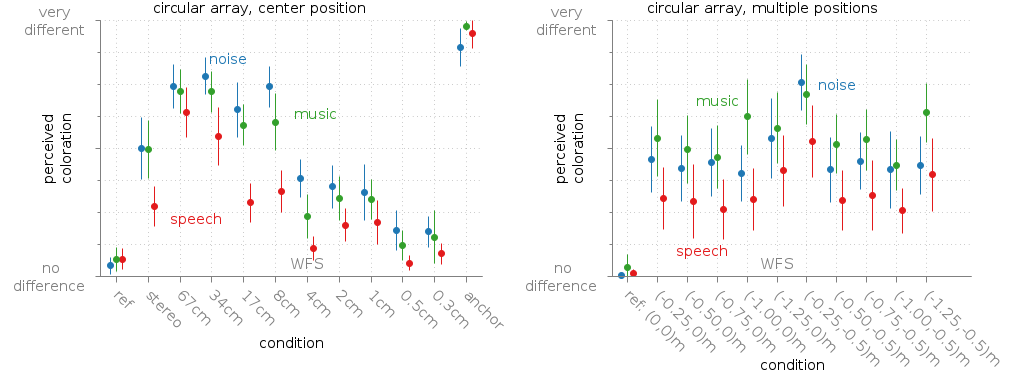
Fig. 33 Mean rated coloration of a point source synthesised with WFS compared to a reference point source. The error bars are showing the confidence intervals.
This database entry contains stimuli and results from the experiments described in [Wierstorf2014a]. In the experiment different WFS systems synthesising a point source were rated in terms of their perceived coloration compared to real point source. This was done for different audio material, namely pink noise, speech, and music and different listener positions. The results are summarised in Fig. 33 and available in the following database files:
experiments/2013-05-01_wfs_coloration/human_label_coloration_wfs_center_positon_music.csv
experiments/2013-05-01_wfs_coloration/human_label_coloration_wfs_center_positon_noise.csv
experiments/2013-05-01_wfs_coloration/human_label_coloration_wfs_center_positon_speech.csv
experiments/2013-05-01_wfs_coloration/human_label_coloration_wfs_multiple_positions_music.csv
experiments/2013-05-01_wfs_coloration/human_label_coloration_wfs_multiple_positions_noise.csv
experiments/2013-05-01_wfs_coloration/human_label_coloration_wfs_multiple_positions_speech.csv
The corresponding stimuli are provided as BRS files that can be used together
with the Binaural simulator and the corresponding scene description file
wfs_coloration.xml to reproduce the exact pink noise signals from the
test. The path to the BRS files is also listed in the first column of the
human label files, so it can directly extracted from them.
| [Wierstorf2014a] | Wierstorf, H., Hohnerlein, C., Spors, S., Raake, A. (2014), “Coloration in Wave Field Synthesis,” 55th International AES Conference, Paper 5-3 |
2015-10-01: Coloration of a point source in Wave Field Synthesis revisited
The first experiment investigating coloration in WFS had some artefacts in the stimuli for high frequencies due to the limitation coming with a finite sampling rate during the process of time delaying single signals in WFS. This time the experiment was repeated using fractional delay filter (add citation). In addition, we added a linear loudspeaker array besides the circular one used in the first experiment.
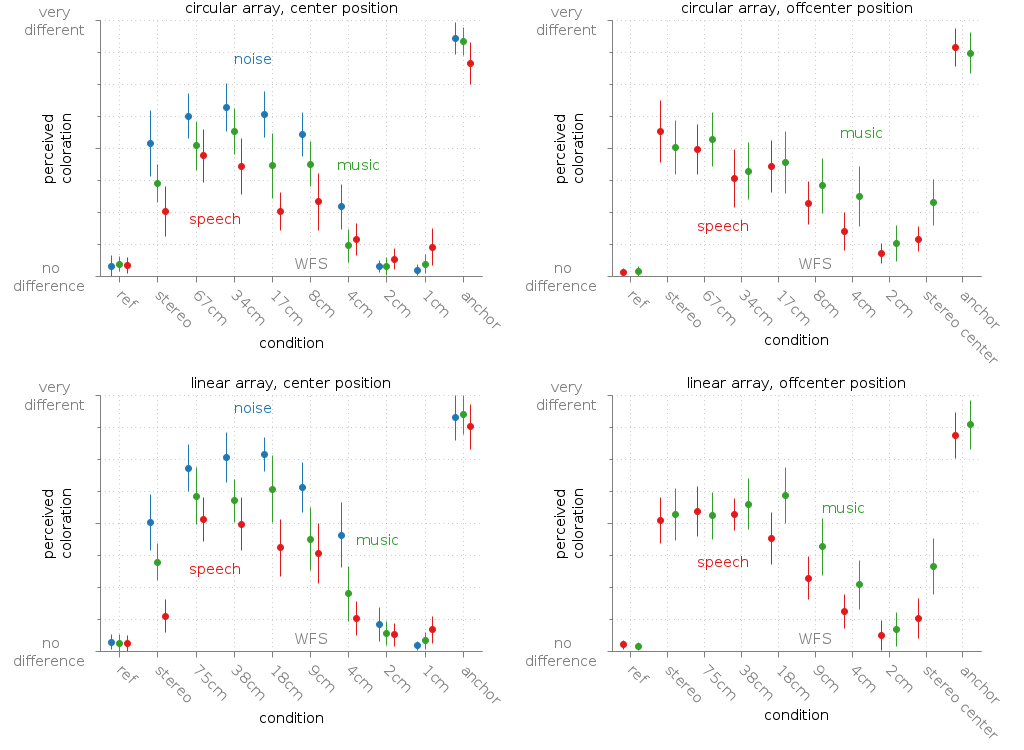
Fig. 34 Median of the rated coloration of a point source synthesized with WFS compared to a reference point source. The error bars are showing the confidence intervals.
The results are available in the following files:
experiments/2015-10-01_wfs_coloration/human_label_coloration_wfs_circular_center_music.csv
experiments/2015-10-01_wfs_coloration/human_label_coloration_wfs_circular_center_noise.csv
experiments/2015-10-01_wfs_coloration/human_label_coloration_wfs_circular_center_speech.csv
experiments/2015-10-01_wfs_coloration/human_label_coloration_wfs_circular_offcenter_music.csv
experiments/2015-10-01_wfs_coloration/human_label_coloration_wfs_circular_offcenter_speech.csv
experiments/2015-10-01_wfs_coloration/human_label_coloration_wfs_linear_center_music.csv
experiments/2015-10-01_wfs_coloration/human_label_coloration_wfs_linear_center_noise.csv
experiments/2015-10-01_wfs_coloration/human_label_coloration_wfs_linear_center_speech.csv
experiments/2015-10-01_wfs_coloration/human_label_coloration_wfs_linear_offcenter_music.csv
experiments/2015-10-01_wfs_coloration/human_label_coloration_wfs_linear_offcenter_speech.csv
Localisation
For the following localisation experiments we provide again BRS files together with the rating results. The BRS files can be used together with the Binaural simulator on order to have the Two!Ears Auditory Model in the same situation as the listener including its ability to turn the head.
2012-03-01: Localisation of a real vs. binaural simulated point source
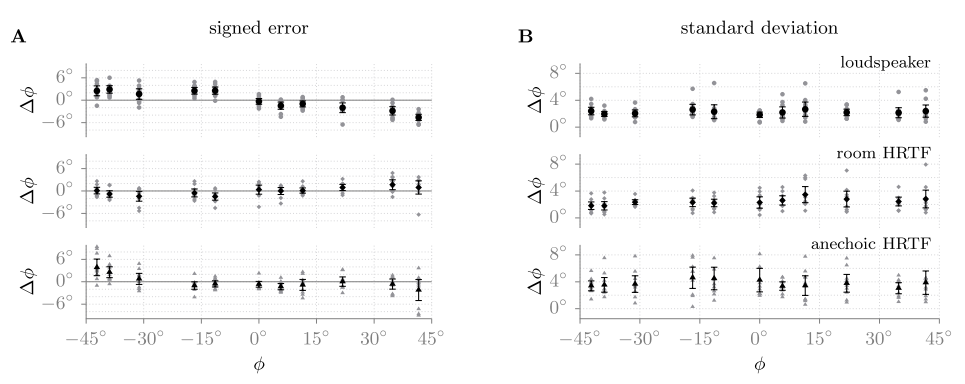
Fig. 35 The mean over all subjects together with the 95% confidence interval is shown. In grey, the individual subjects’ results are presented. In graph A, the signed error of the localization of the eleven speakers is shown. In graph B, the mean standard deviation for the localization task is depicted. The top row represents the condition with the real loudspeakers, the middle row the room HRTFs (BRIRs), and the bottom row the anechoic HRTFs. Figure from [Wierstorf2012].
In this experiment the localisation of a real point source realised by a loudspeaker was compared to the localisation of a binaural simulation of the same source using HRTFs or BRIRs. The results are published in [Wierstorf2012]. The mean localisation results are stored in the corresponding human label file which comes together with the BRS files:
experiments/2012-03-01_brs_vs_real_localisation/human_label_localisation_real_vs_simulated_loudspeaker.csv
In addition, we provide the trajectory of the actual head movements, each
listener performed during the experiments in the folder
experiments/2012-03-01_brs_vs_real_localisation/head_movements_real_vs_simulated_loudspeaker/.
| [Wierstorf2012] | Wierstorf, H., Spors, S., Raake, A. (2012), “Perception and evaluation of sound fields,” 59th Open Seminar on Acoustics, p. 263-68 |
2013-11-01: Localisation of different source types in sound field synthesis
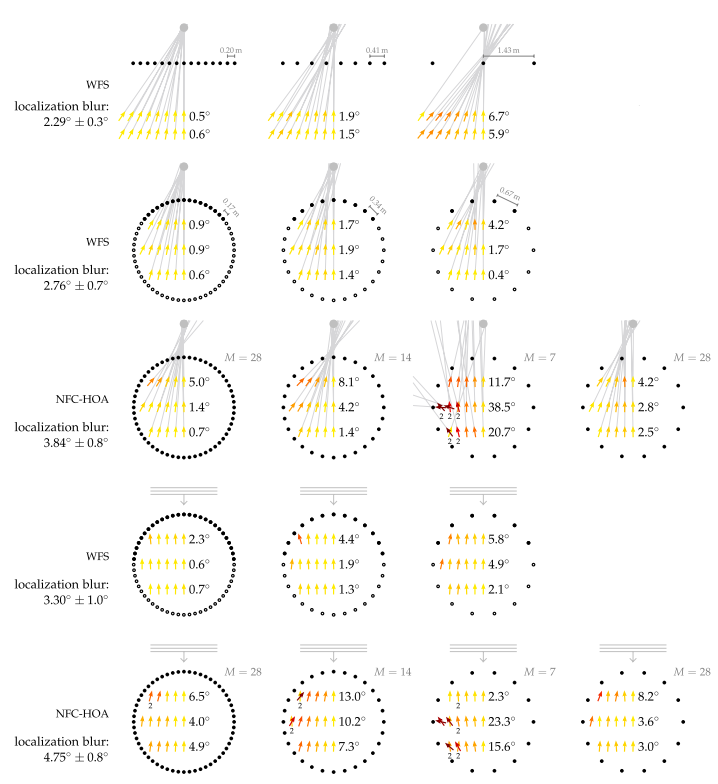
Fig. 36 Average localization results. The black symbols indicate loudspeakers, the grey ones the synthesised source. At every listening position, an arrow is pointing into the direction from which the listeners perceived the corresponding auditory event. The color of the arrow displays the absolute localization error, which is also summarised as an average beside the arrows for every row of positions. The average confidence interval for all localization results is 2.3°. Listening conditions which resulted in listeners saying that they perceived two sources are highlighted with a small 2 written below the position. Figure from [Wierstorf2014b].
In this experiment listeners localised different synthesised sources using different sound field synthesis methods and loudspeaker setups. The experiment is described in [Wierstorf2014b]. Here, we are providing the BRS files that were used for binaural simulations of the different systems and listener positions during the experiment and the corresponding rating results of the listeners.
experiments/2013-11-01_sfs_localisation/human_label_localization_wfs_ps_circular.txt
experiments/2013-11-01_sfs_localisation/human_label_localization_wfs_ps_linear.txt
experiments/2013-11-01_sfs_localisation/human_label_localization_wfs_pw_circular.txt
experiments/2013-11-01_sfs_localisation/human_label_localization_wfs_fs_circular.txt
experiments/2013-11-01_sfs_localisation/human_label_localization_nfchoa_ps_circular.txt
experiments/2013-11-01_sfs_localisation/human_label_localization_nfchoa_pw_circular.txt
In addition, we provide the trajectory of the actual head movements, each
listener performed during the localisation experiment with the linear
loudspeaker array in the folder
experiments/2013-11-01_sfs_localisation/head_movements_wfs_ps_linear/.
| [Wierstorf2014b] | Wierstorf, H. (2014), “Perceptual Assessment of Sound Field Synthesis,” PhD-thesis, TU Berlin |
Quality ratings
2014-04-01: Scene related sound quality
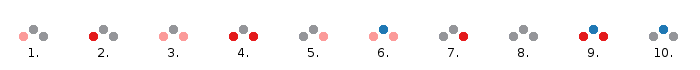
Fig. 37 The ten different conditions of the quality test.
We did a preference test where we asked for the preferred audio quality of the presented stimuli, see [Raake2014] for details. The stimuli consisted always of the same acoustic scene with three individual sources, which had different degrees of impairments. We provide the ratings of the listeners and the WAV-files of the stimuli in the following folders:
experiments/2014-04-01_scene_quality/stimuli/*
experiments/2014-04-01_scene_quality/results/*
| [Raake2014] | Raake, A., Wierstorf, H., Blauert J. (2014) “A case for TWO!EARS in audio quality assessment”, Forum Acusticum |