Experiment results
In this part of the database we collect results from psychoacoustic experiments run by the different labs involved in Two!Ears.
Coloration
Coloration of a point source in Wave Field Synthesis
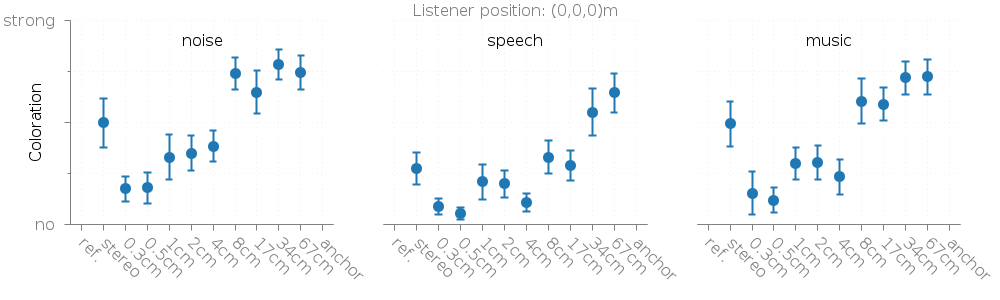
Fig. 31 Mean rated coloration of a point source synthesised with WFS compared to a reference point source. The error bars are showing the confidence intervals.
This database entry contains stimuli and results from the experiments described in [Wierstorf2014a]. In the experiment different WFS systems synthesising a point source were rated in terms of their perceived coloration compared to real point source. This was done for different audio material, namely pink noise, speech, and music and different listener positions. The results are summarised in Fig. 31 and available in the following database files:
experiments/sound_field_synthesis/coloration/human_label_center_positon_music.csv
experiments/sound_field_synthesis/coloration/human_label_center_positon_noise.csv
experiments/sound_field_synthesis/coloration/human_label_center_positon_speech.csv
experiments/sound_field_synthesis/coloration/human_label_multiple_positions_music.csv
experiments/sound_field_synthesis/coloration/human_label_multiple_positions_noise.csv
experiments/sound_field_synthesis/coloration/human_label_multiple_positions_speech.csv
The corresponding stimuli are provided as BRS files that can be used together
with the Binaural simulator and the corresponding the corresponding scene description file
wfs_coloration.xml to reproduce the exact pink noise signals from the
test. The available BRS files are summarised in the *.flist files that
simply provide listings of them.
experiments/sound_field_synthesis/coloration/wfs_coloration.xml
experiments/sound_field_synthesis/coloration/center_positon.flist
experiments/sound_field_synthesis/coloration/multiple_positions.flist
| [Wierstorf2014a] | Wierstorf, H., Hohnerlein, C., Spors, S., Raake, A. (2014), “Coloration in Wave Field Synthesis,” 55th International AES Conference, Paper 5-3 |
Localisation
For the following localisation experiments we provide again BRS files together with the rating results. The BRS files can be used together with the Binaural simulator on order to have the Two!Ears Auditory Model in the same situation as the listener including its ability to turn the head.
Localisation of a point source
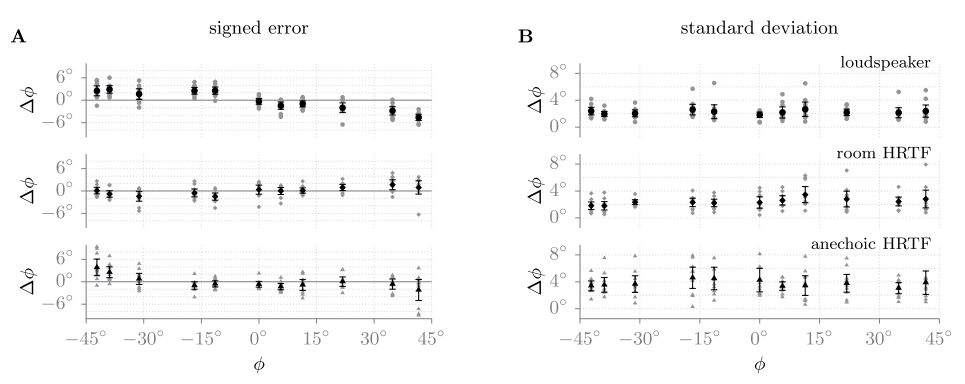
Fig. 32 The mean over all subjects together with the 95% confidence interval is shown. In grey, the individual subjects’ results are presented. In graph A, the signed error of the localization of the eleven speakers is shown. In graph B, the mean standard deviation for the localization task is depicted. The top row represents the condition with the real loudspeakers, the middle row the room HRTFs (BRIRs), and the bottom row the anechoic HRTFs.
In this experiment the localisation of a real point source realised by a loudspeaker was compared to the localisation of a binaural simulation of the same source using HRTFs or BRIRs. The results are published in [Wierstorf2012]. We do not provide the localisation results, but the head movements of the listener performed during the experiment together with the BRS files used for the binaural simulations of the point source.
experiments/sound_field_synthesis/localisation/single_loudspeaker_anechoic.flist
experiments/sound_field_synthesis/localisation/single_loudspeaker_room_calypso.flist
experiments/sound_field_synthesis/localisation/human_label_head_movements_real_vs_simulated_loudspeaker/*
| [Wierstorf2012] | Wierstorf, H., Spors, S., Raake, A. (2012), “Perception and evaluation of sound fields,” 59th Open Seminar on Acoustics, p. 263-68 |
Localisation of different source types in sound field synthesis
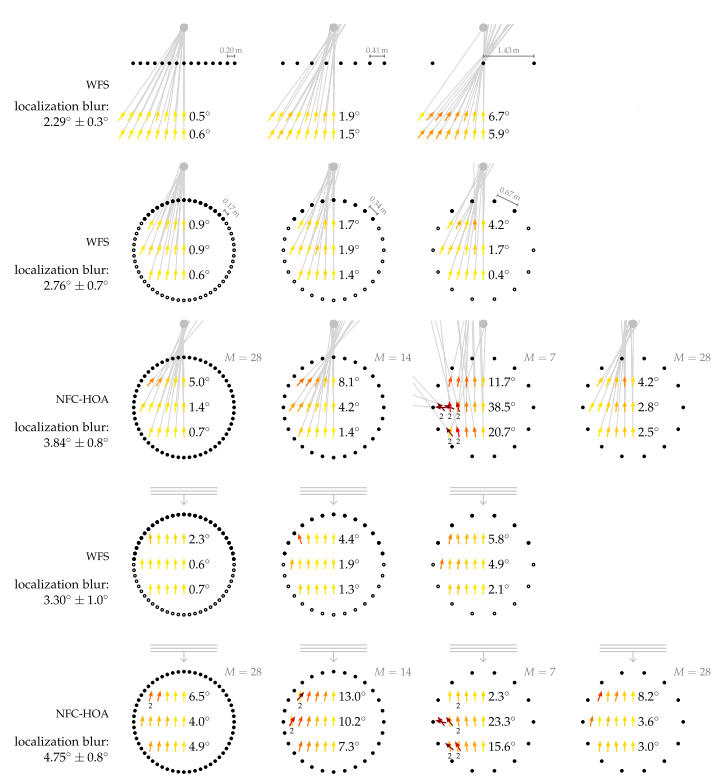
Fig. 33 Average localization results. The black symbols indicate loudspeakers, the grey ones the synthesised source. At every listening position, an arrow is pointing into the direction from which the listeners perceived the corresponding auditory event. The color of the arrow displays the absolute localization error, which is also summarised as an average beside the arrows for every row of positions. The average confidence interval for all localization results is 2.3°. Listening conditions which resulted in listeners saying that they perceived two sources are highlighted with a small 2 written below the position.
In this experiment listeners localised different synthesised sources using different sound field synthesis methods and loudspeaker setups. The experiment is described in [Wierstorf2014b]. Here, we are providing the BRS files that were used for binaural simulations of the different systems and listener positions during the experiment and the corresponding rating results of the listeners.
experiments/sound_field_synthesis/localisation/human_label_localization_wfs_ps_circular.txt
experiments/sound_field_synthesis/localisation/human_label_localization_wfs_ps_linear.txt
experiments/sound_field_synthesis/localisation/wfs_ps_circular.flist
experiments/sound_field_synthesis/localisation/wfs_ps_linear.flist
experiments/sound_field_synthesis/localisation/human_label_localization_wfs_pw_circular.txt
experiments/sound_field_synthesis/localisation/wfs_pw_circular.flist
experiments/sound_field_synthesis/localisation/human_label_localization_wfs_fs_circular.txt
experiments/sound_field_synthesis/localisation/wfs_fs_circular.flist
experiments/sound_field_synthesis/localisation/human_label_localization_nfchoa_ps_circular.txt
experiments/sound_field_synthesis/localisation/nfchoa_ps_circular.flist
experiments/sound_field_synthesis/localisation/human_label_localization_nfchoa_pw_circular.txt
experiments/sound_field_synthesis/localisation/nfchoa_pw_circular.flist
| [Wierstorf2014b] | Wierstorf, H. (2014), “Perceptual Assessment of Sound Field Synthesis,” PhD-thesis, TU Berlin |
Quality ratings
Scene related sound quality
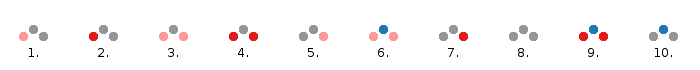
Fig. 34 The ten different conditions of the quality test.
We did a preference test where we asked for the preferred audio quality of the presented stimuli, see [Raake2014] for details. The stimuli consisted always of the same acoustic scene with three individual sources, which had different degrees of impairments. We provide the ratings of the listeners and the WAV-files of the stimuli in the following folders:
experiments/sound_field_synthesis/scene_quality/stimuli/*
experiments/sound_field_synthesis/scene_quality/results/*
| [Raake2014] | Raake, A., Wierstorf, H., Blauert J. (2014) “A case for TWO!EARS in audio quality assessment”, Forum Acusticum |