Coloration
2013-05-01: Coloration of a point source in Wave Field Synthesis
 Published by members of the Two!Ears consortium
Digital Object Identifier
Description
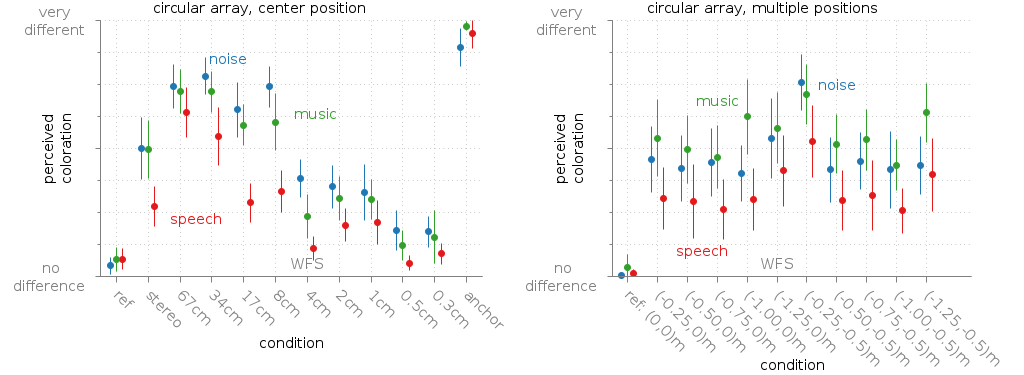
Fig. 49 Mean rated coloration of a point source synthesised with WFS compared to a reference point source. The error bars are showing the confidence intervals.
This database entry contains stimuli and results from the experiments described in [Wierstorf2014a]. In the experiment different WFS systems synthesising a point source were rated in terms of their perceived coloration compared to a real point source. This was done for different audio material, namely pink noise, speech, and music and different listener positions. The different WFS systems consisted always of a circular loudspeaker array with a radius of 3m, but different number of employed loudspeakers. To control for the exact listening position, allow instantaneous switching between listening positions, and allow for very high numbers of loudspeakers in the WFS systems the experiment was performed with binaural synthesis without head tracking. The results are summarised in Fig. 49.
Files
The BRS files for the binaural simulation can be found at:
experiments/2013-05-01_wfs_coloration/brs/*
For the music stimulus a twelve second clip from the electronic song “Luv deluxe” by “Cinnamon Chasers” was chosen, which is not published in this database. The applied speech and pink noise stimuli can be found under:
experiments/2013-05-01_wfs_coloration/stimuli/pink_noise_pulse.wav
experiments/2013-05-01_wfs_coloration/stimuli/speech.wav
The single results of the listeners and an analysis are available under:
experiments/2013-05-01_wfs_coloration/results/*
experiments/2013-05-01_wfs_coloration/analysis/*
Where of special interest are the mean rating results shown in Fig. 49:
experiments/2013-05-01_wfs_coloration/analysis/data_mean/coloration_wfs_center_music.csv
experiments/2013-05-01_wfs_coloration/analysis/data_mean/coloration_wfs_center_noise.csv
experiments/2013-05-01_wfs_coloration/analysis/data_mean/coloration_wfs_center_speech.csv
experiments/2013-05-01_wfs_coloration/analysis/data_mean/coloration_wfs_multiple_music.csv
experiments/2013-05-01_wfs_coloration/analysis/data_mean/coloration_wfs_multiple_noise.csv
experiments/2013-05-01_wfs_coloration/analysis/data_mean/coloration_wfs_multiple_speech.csv
Note
This experiment has a flaw for the results using very high number of loudspeakers. In this case some of the perceivable coloration was due to some artifacts arriving from the fact that we employed only integer delay in the delay line involved in the WFS processing. See the next experiment for a corrected version.
| [Wierstorf2014a] | Wierstorf, H., Hohnerlein, C., Spors, S., Raake, A. (2014), “Coloration in wave field synthesis,” 55th International Aes Conference, Paper 5-3 |
2015-10-01: Coloration of a point source in Wave Field Synthesis revisited
Published by members of the Two!Ears consortium
Digital Object Identifier
Description
The first experiment investigating coloration in WFS had some artefacts in the stimuli for high frequencies due to the limitation coming with a finite sampling rate during the process of time delaying single signals in WFS. This time the experiment was repeated using fractional delay filter. In addition, we added a linear loudspeaker array besides the circular one used in the first experiment.
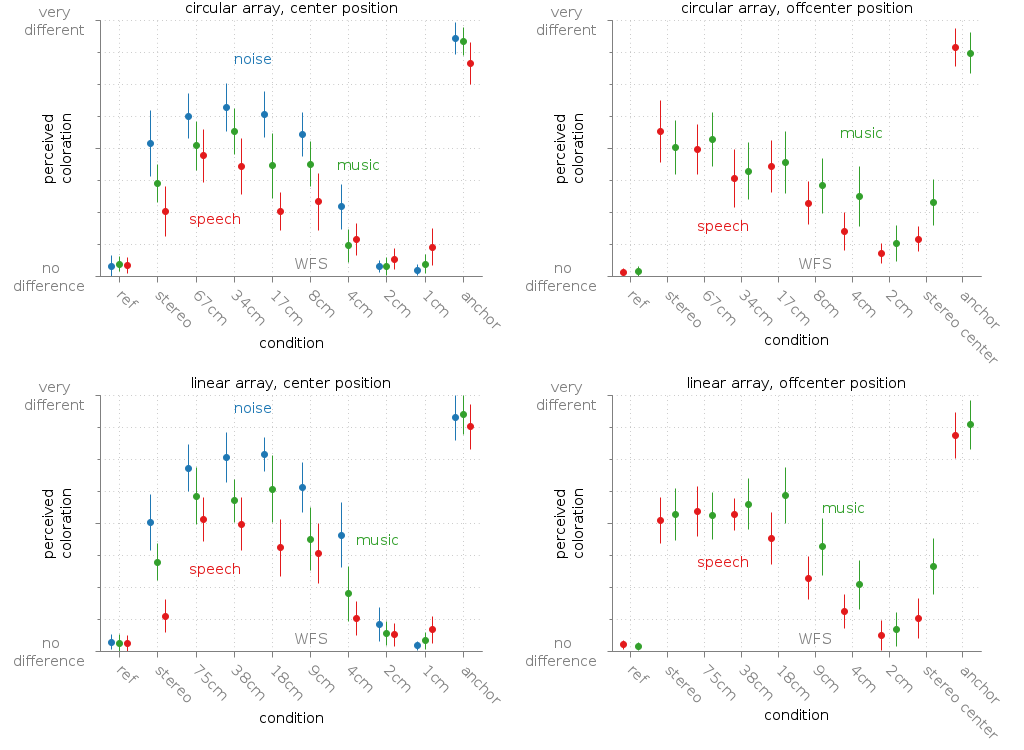
Fig. 50 Median of the rated coloration of a point source synthesized with WFS compared to a reference point source. The error bars are showing the confidence intervals.
Files
The BRS files for the binaural simulation, and the speech and pink noise stimuli are available under:
experiments/2015-10-01_wfs_coloration/brs/*
experiments/2015-10-01_wfs_coloration/stimuli/pink_noise_pulse.wav
experiments/2015-10-01_wfs_coloration/stimuli/speech.wav
The results of the single listeners and an analysis are available under:
experiments/2015-10-01_wfs_coloration/results/*
experiments/2015-10-01_wfs_coloration/analysis/*
The average results, plotted in Fig. 50, are stored under:
experiments/2015-10-01_wfs_coloration/analysis/data_mean/coloration_wfs_circular_center_music.csv
experiments/2015-10-01_wfs_coloration/analysis/data_mean/coloration_wfs_circular_center_noise.csv
experiments/2015-10-01_wfs_coloration/analysis/data_mean/coloration_wfs_circular_center_speech.csv
experiments/2015-10-01_wfs_coloration/analysis/data_mean/coloration_wfs_circular_offcenter_music.csv
experiments/2015-10-01_wfs_coloration/analysis/data_mean/coloration_wfs_circular_offcenter_speech.csv
experiments/2015-10-01_wfs_coloration/analysis/data_mean/coloration_wfs_linear_center_music.csv
experiments/2015-10-01_wfs_coloration/analysis/data_mean/coloration_wfs_linear_center_noise.csv
experiments/2015-10-01_wfs_coloration/analysis/data_mean/coloration_wfs_linear_center_speech.csv
experiments/2015-10-01_wfs_coloration/analysis/data_mean/coloration_wfs_linear_offcenter_music.csv
experiments/2015-10-01_wfs_coloration/analysis/data_mean/coloration_wfs_linear_offcenter_speech.csv
2015-10-05: Coloration of a point source in Local Wave Field Synthesis
Published by members of the Two!Ears consortium
Description
In the experiment a circular 56-channel loudspeaker array with a radius of 3 m was driven by different sound field synthesis techniques in order to reproduce a virtual point source. The different techniques were WFS, spectral band-limited NFC-HOA, and local WFS, which is similar to spectral band-limited NFC-HOA in showing a high aliasing frequency in a small region. The techniques were rated in terms of their perceived coloration compared to a real point source using a Multi-Stimulus with Hidden Anchor and Reference (MUSHRA) test paradigm. This was done for different audio material, namely pink noise, speech, and music. The listener was positioned in the center of the loudspeaker array. The experiments has been repeated for an off center listening position. To control for the exact listening position, allow instantaneous switching between listening positions, and the experiment was performed with binaural synthesis without head tracking. The results are summarised in Fig. 51 and Fig. 52.
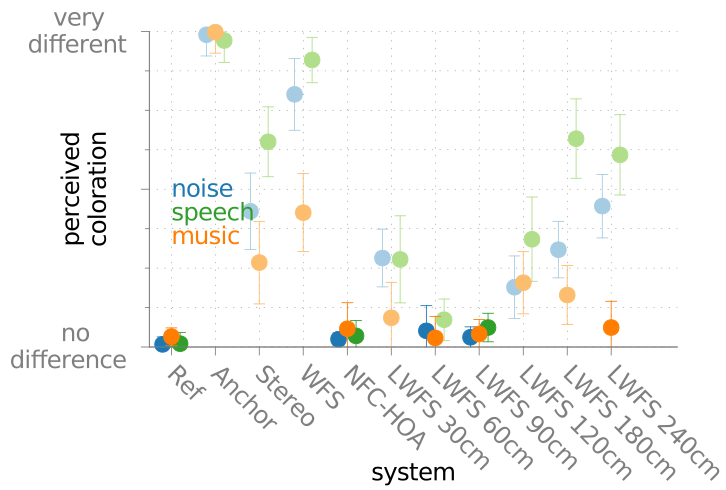
Fig. 51 Median of the rated coloration of a point source synthesized with different
sound field synthesis techniques compared to a reference point source for a
centered listening positions. The error bars are showing the first and the
third quartile. The points with lower saturated color show a significant
difference from the reference. The length given after Local Wave Field
Synthesis (LWFS) denotes the radius of the local listening area. For details
see the PDF version of this figure.
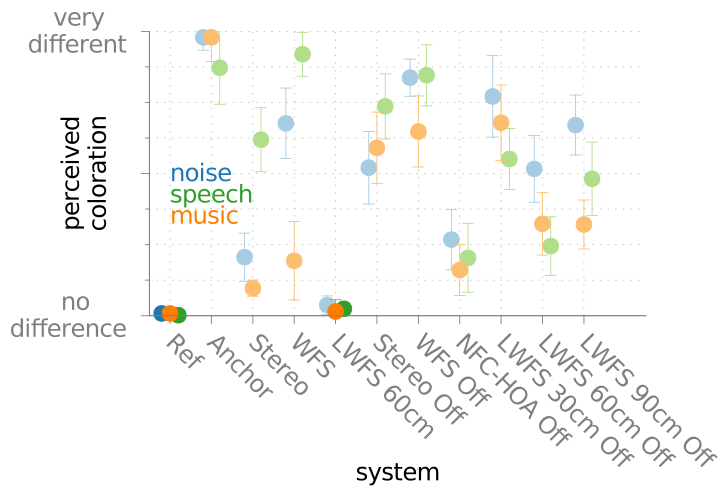
Fig. 52 Median of the rated coloration of a point source synthesized with different
sound field synthesis techniques compared to a reference point source for
an off-center listening position (marked by Off). For details see the
PDF version
of this figure.
Files
The BRS files for the binaural simulation are available under:
experiments/2015-10-05_localwfs_coloration/brs/*
The results of the single listeners and an analysis are available under:
experiments/2015-10-01_wfs_coloration/results/*
experiments/2015-10-01_wfs_coloration/analysis/*
The average results as well as the statistical significances plotted in the figures, are stored under:
experiments/2015-10-05_localwfs_coloration/analysis/stats_music_center.txt
experiments/2015-10-05_localwfs_coloration/analysis/stats_music_off.txt
experiments/2015-10-05_localwfs_coloration/analysis/stats_noise_center.txt
experiments/2015-10-05_localwfs_coloration/analysis/stats_noise_off.txt
experiments/2015-10-05_localwfs_coloration/analysis/stats_speech_center.txt
experiments/2015-10-05_localwfs_coloration/analysis/stats_speech_off.txt
Note
This experiment has a flaw that the used sample rate of the stimuli and for creating the BRS files was 48000 Hz while the sample rate for the HRTF dataset was 44100 Hz. Hence, the HRTF were scaled with respect to frequency.